

Finding memory leaks and cpu bottlenecks which build up over time can be quite a challenge. To troubleshoot this, the first thing you need to do is create a process dump using procdump. Download procdump from here: https://learn.microsoft.com/en-us/sysinternals/downloads/procdump
procdump.exe -ma Worker.exe e:\dumpsThis create a dmp file (.dmp)
Next, install windbg on your machine. Run the following a Powershell windows.
First, install winget as following:
$progressPreference = 'silentlyContinue'
Write-Host "Installing WinGet PowerShell module from PSGallery..."
Install-PackageProvider -Name NuGet -Force | Out-Null
Install-Module -Name Microsoft.WinGet.Client -Force -Repository PSGallery | Out-Null
Write-Host "Using Repair-WinGetPackageManager cmdlet to bootstrap WinGet..."
Repair-WinGetPackageManager
Write-Host "Done."
Then, install windbg
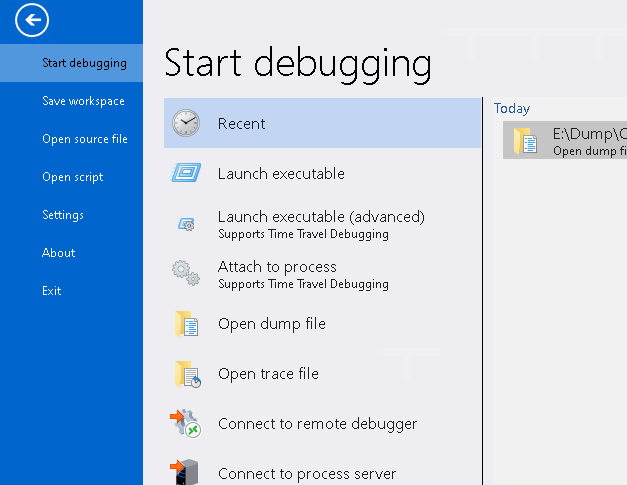
winget install Microsoft.WinDbg --accept-package-agreementOpen windbg, click file and select Open dump file
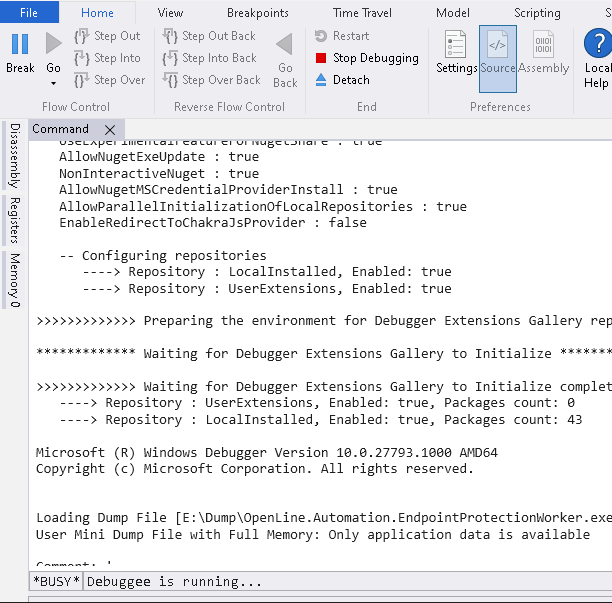
Windbg is now analyzing the file, wait until this is done. This can take quite some time.
Next step is to load the correct symbols, enter the following command:
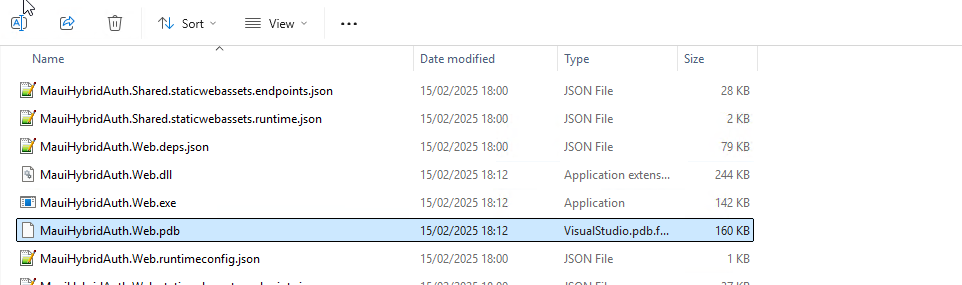
.symfixNow enter the path where you apps pdb file is located.
Now reload the symbols
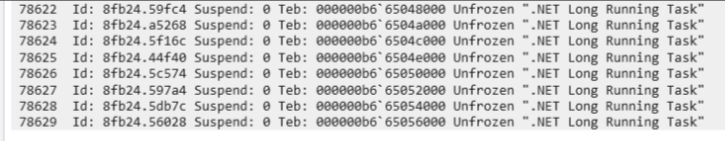
.reloadIn this particular issue, I have run the following command to list all threads
~Running this showed the following, my app was spawning almost 80.000 threads without closing them properly.
This way, you have a clear view of what needs to be fixed. In my specific case, I created a listener for a RabbitMQ queue. This caused the thread to spawn without closing them properly.